Freedom Times has moved to:
SOUND OFF: WORLD VIEWS AND THE EMPOWERMENT FACTOR
This site will remain open for the records
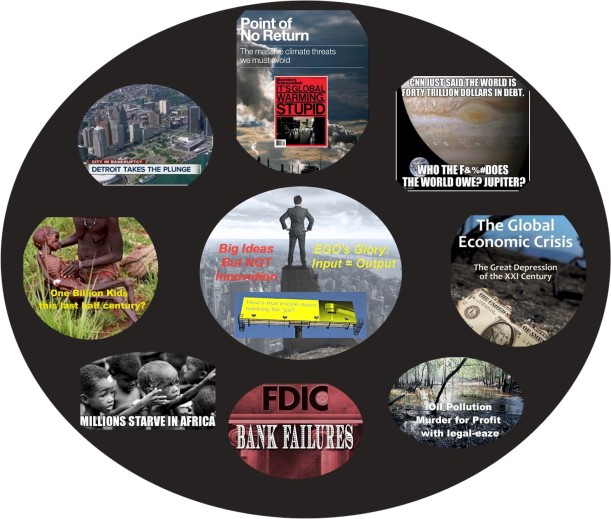
*Forces shaping Freedom's Directional Currents - *Choices to change the direction we are heading *Current Obstacles & Challenges: outdated energy & educational base, caused by a prehistoric ill defined corporate/economic model totally deficient and lacking Scientific Evolutionary Survival Parameters necessary for Life's evolution, sustainability, and survival.


 Repost Peter Jocis via Spirit Science


| Rank | Country | Price of one gallon of regular gasoline | Per capita daily income | Pain at the pumpi | Daily per capita consumption of gasoline | Percentage of income spent on gasoline |
| 1 | Norwayt | $10.08 | $288.98 | 3.49% | 0.24gal | 0.84% |
| 2 | Turkeyt | 9.55 | 30.78 | 31.02 | 0.03 | 0.86 |
| 3 | Netherlandst | 8.89 | 131.76 | 6.74 | 0.24 | 1.65 |
| 4 | Italyt | 8.61 | 93.24 | 9.24 | 0.17 | 1.56 |
| 5 | Greecet | 8.30 | 59.30 | 14.00 | 0.32 | 4.48 |
| 6 | Portugalt | 8.27 | 56.68 | 14.58 | 0.13 | 1.87 |
| 7 | Francet | 8.13 | 117.81 | 6.90 | 0.12 | 0.83 |
| 8 | Hong Kongt | 8.11 | 106.29 | 7.63 | 0.05 | 0.40 |
| 9 | Swedent | 8.10 | 164.44 | 4.93 | 0.40 | 1.97 |
| 10 | Belgiumt | 8.05 | 125.17 | 6.43 | 0.15 | 0.98 |
| 10 | Finlandt | 8.05 | 133.44 | 6.04 | 0.30 | 1.84 |
| 12 | Germanyt | 8.01 | 120.58 | 6.64 | 0.24 | 1.57 |
| 13 | Denmarkt | 7.92 | 160.73 | 4.92 | 0.28 | 1.36 |
| 14 | Israelt | 7.86 | 88.35 | 8.89 | 0.32 | 2.89 |
| 15 | Irelandt | 7.79 | 132.14 | 5.89 | 0.32 | 1.86 |
| 16 | United Kingdomt | 7.75 | 104.11 | 7.44 | 0.24 | 1.77 |
| 17 | Sloveniat | 7.39 | 62.07 | 11.91 | 0.27 | 3.23 |
| 18 | Slovakiat | 7.31 | 49.56 | 14.76 | 0.11 | 1.65 |
| 19 | Maltat | 7.27 | 60.80 | 11.95 | 0.15 | 1.83 |
| 20 | Switzerlandt | 7.25 | 220.47 | 3.29 | 0.39 | 1.30 |
| 21 | Spaint | 7.00 | 82.49 | 8.48 | 0.12 | 1.02 |
| 22 | Hungaryt | 6.91 | 36.56 | 18.89 | 0.13 | 2.53 |
| 23 | Czech Republict | 6.84 | 52.72 | 12.97 | 0.17 | 2.15 |
| 24 | Austriat | 6.80 | 136.56 | 4.98 | 0.21 | 1.05 |
| 25 | Cyprust | 6.78 | 72.10 | 9.41 | 0.35 | 3.29 |
| 26 | Croatiat | 6.70 | 37.41 | 17.91 | 0.14 | 2.59 |
| 27 | Luxembourgt | 6.51 | 307.22 | 2.12 | 0.68 | 1.43 |
| 28 | New Zealandt | 6.50 | 112.01 | 5.80 | 0.51 | 2.96 |
| 29 | Latviat | 6.49 | 41.88 | 15.50 | 0.12 | 1.83 |
| 30 | Lithuaniat | 6.44 | 42.08 | 15.31 | 0.06 | 0.89 |
| 30 | South Koreat | 6.44 | 68.63 | 9.38 | 0.16 | 1.51 |
| 32 | Bulgariat | 6.40 | 20.77 | 30.83 | 0.08 | 2.39 |
| 33 | Romaniat | 6.35 | 24.04 | 26.41 | 0.07 | 1.73 |
| 34 | Singaporet | 6.33 | 142.96 | 4.43 | 0.17 | 0.76 |
| 35 | Polandt | 6.28 | 35.82 | 17.53 | 0.11 | 1.89 |
| 36 | Chilet | 6.22 | 44.58 | 13.95 | 0.14 | 2.00 |
| 37 | Estoniat | 6.10 | 49.39 | 12.35 | 0.20 | 2.49 |
| 38 | Japant | 5.90 | 110.80 | 5.32 | 0.33 | 1.76 |
| 39 | Brazilt | 5.58 | 33.67 | 16.57 | 0.08 | 1.40 |
| 40 | Argentinat | 5.38 | 32.93 | 16.35 | 0.10 | 1.62 |
| 41 | Australiat | 5.30 | 188.87 | 2.80 | 0.61 | 1.72 |
| 42 | South Africat | 4.94 | 19.88 | 24.85 | 0.17 | 4.25 |
| 43 | Indiat | 4.74 | 4.36 | 108.65 | 0.01 | 1.26 |
| 44 | Philippinest | 4.71 | 7.99 | 58.96 | 0.03 | 1.73 |
| 45 | Canadat | 4.67 | 143.10 | 3.27 | 0.93 | 3.03 |
| 45 | Chinat | 4.67 | 18.16 | 25.71 | 0.05 | 1.30 |
| 47 | Thailandt | 4.65 | 18.01 | 25.84 | 0.08 | 1.94 |
| 48 | Colombiat | 4.52 | 22.57 | 20.03 | 0.06 | 1.14 |
| 49 | Pakistant | 3.87 | 3.59 | 108.01 | 0.01 | 1.37 |
| 50 | United Statest | 3.66 | 140.41 | 2.60 | 1.22 | 3.18 |
| 51 | Indonesiat | 3.62 | 10.46 | 34.60 | 0.08 | 2.67 |
| 52 | Mexicot | 3.43 | 30.11 | 11.38 | 0.28 | 3.18 |
| 53 | Russiat | 3.39 | 42.88 | 7.90 | 0.23 | 1.82 |
| 54 | Malaysiat | 2.31 | 29.99 | 7.69 | 0.31 | 2.37 |
| 55 | Nigeriat | 2.27 | 4.59 | 49.51 | 0.04 | 1.76 |
| 56 | Irant | 2.16 | 15.25 | 14.15 | 0.22 | 3.18 |
| 57 | United Arab E…t | 1.77 | 177.48 | 1.00 | 0.46 | 0.46 |
| 58 | Egyptt | 1.00 | 8.62 | 11.63 | 0.06 | 0.75 |
| 59 | Kuwaitt | 0.80 | 122.15 | 0.65 | 0.83 | 0.54 |
| 60 | Saudi Arabiat | 0.45 | 68.94 | 0.66 | 0.64 | 0.42 |
| 61 | Venezuelat | 0.04 | 31.58 | 0.13 | 0.40 | 0.05 |


 Millions of people have no money set aside for their later years, while even responsible savers are falling behind read more
“They are casualties of broad economic, social and other forces, from high unemployment, stagnant income and spiraling health care costs to eroding labor protections and rising income inequality. Behind these currents, as always, are political choices we make as a nation, along with the deep-pocketed special interests that steer public policy in ways that may not align with the common good”.


 At $26.7 billion last year, they were almost twice what all of America's minimum-wage workers combined were paid. March 17 5:30 AM http://www.cbsnews.com/news/a-mind-boggling-statistic-about-wall-street-bonuses


